Counties with the highest unemployment in Kentucky
Published 3:50 pm Friday, August 30, 2024
Counties with the highest unemployment in Kentucky
Unemployment rates are rising across U.S. metropolitan areas, provoking alarm across the nation and likely leading to interest rate cuts in September.
As of July, unemployment rates increased in 350 out of 389 U.S. metros areas—including 47 of the 51 largest metros, according to Bureau of Labor Statistics data.
To get a glimpse of regional variations in employment, Stacker compiled a list of counties with the highest unemployment rates in Kentucky, using BLS data. Counties are ranked by their preliminary unemployment rate in July 2024, with initial ties broken by the number of unemployed people within that county, though some ties may remain. County-level unemployment rates are not seasonally adjusted.
The national unemployment rate remains relatively low at 4.3%. Still, it’s up substantially from 3.5% during the same month last year and has climbed to the highest rate since November 2021. By comparison, unemployment rates surged to 10% in October 2009 during the Great Recession, and a full recovery took years. At the height of the brief COVID-19 recession in April 2020, unemployment hit 14.7%.
The Federal Reserve has shifted its focus from curbing inflation to unemployment, indicating plans to cut interest rates in the coming weeks and months to alleviate economic strain and avoid further job losses.
Since last year, unemployment has spiked in over half of states—a signal often indicating a looming recession, as Piper Sandler Chief Global Economist Nancy Lazar told Business Insider. These jobless rates, paired with layoffs among major U.S. employers like Google and Tesla, have sparked concern among Americans. Minus a major economic blow, economists continue to forecast that the U.S. is tracking toward an incremental slowdown in growth known as a “soft landing.”
To get a better idea of your community’s current economy, read on to see the counties with the highest unemployment in Kentucky.
You may also like: How many people are receiving substance use treatment in Kentucky
![]()

Canva
#50. Breckinridge County
– July unemployment rate (preliminary): 6.0%
— 1-month change: Up 0.4 percentage points
— 1-year change: Up 0.7 percentage points
– Total labor force: 8,042 people (479 unemployed)

Canva
#49. Lincoln County
– July unemployment rate (preliminary): 6.0%
— 1-month change: Up 0.2 percentage points
— 1-year change: Up 0.5 percentage points
– Total labor force: 9,312 people (559 unemployed)

Canva
#48. Montgomery County
– July unemployment rate (preliminary): 6.0%
— 1-month change: Up 0.3 percentage points
— 1-year change: Up 0.3 percentage points
– Total labor force: 11,690 people (698 unemployed)

Canva
#47. Bullitt County
– July unemployment rate (preliminary): 6.0%
— 1-month change: Up 1.6 percentage points
— 1-year change: Up 1.9 percentage points
– Total labor force: 43,567 people (2,632 unemployed)

Canva
#46. Union County
– July unemployment rate (preliminary): 6.1%
— 1-month change: Up 0.1 percentage points
— 1-year change: Up 0.3 percentage points
– Total labor force: 6,013 people (369 unemployed)
You may also like: Best public high schools in Kentucky

Canva
#45. Christian County
– July unemployment rate (preliminary): 6.1%
— 1-month change: Up 0.2 percentage points
— 1-year change: Up 0.6 percentage points
– Total labor force: 24,856 people (1,515 unemployed)

Canva
#44. Hickman County
– July unemployment rate (preliminary): 6.2%
— 1-month change: Up 0.5 percentage points
— 1-year change: Up 0.9 percentage points
– Total labor force: 1,664 people (103 unemployed)

Canva
#43. McLean County
– July unemployment rate (preliminary): 6.2%
— 1-month change: Up 0.2 percentage points
— 1-year change: Up 1.5 percentage points
– Total labor force: 3,922 people (242 unemployed)

Maxine Livingston // Shutterstock
#42. Estill County
– July unemployment rate (preliminary): 6.2%
— 1-month change: Up 0.2 percentage points
— 1-year change: Up 0.6 percentage points
– Total labor force: 5,200 people (324 unemployed)

woodsnorthphoto // Shutterstock
#41. Meade County
– July unemployment rate (preliminary): 6.2%
— 1-month change: Up 0.9 percentage points
— 1-year change: Up 1.4 percentage points
– Total labor force: 12,142 people (758 unemployed)
You may also like: Counties where children have the best opportunity for economic mobility in Kentucky

Canva
#40. Clinton County
– July unemployment rate (preliminary): 6.3%
— 1-month change: Down 0.2 percentage points
— 1-year change: Up 0.7 percentage points
– Total labor force: 3,451 people (219 unemployed)

Canva
#39. Hopkins County
– July unemployment rate (preliminary): 6.3%
— 1-month change: Up 0.2 percentage points
— 1-year change: Up 1.7 percentage points
– Total labor force: 18,953 people (1,193 unemployed)

Patrick Jennings // Shutterstock
#38. Fleming County
– July unemployment rate (preliminary): 6.5%
— 1-month change: Up 0.4 percentage points
— 1-year change: Up 1.0 percentage points
– Total labor force: 5,820 people (376 unemployed)

Canva
#37. Adair County
– July unemployment rate (preliminary): 6.5%
— 1-month change: Up 0.2 percentage points
— 1-year change: Up 0.8 percentage points
– Total labor force: 7,395 people (483 unemployed)

Sean Pavone // Shutterstock
#36. Whitley County
– July unemployment rate (preliminary): 6.5%
— 1-month change: Up 0.2 percentage points
— 1-year change: Up 0.9 percentage points
– Total labor force: 13,819 people (902 unemployed)
You may also like: Counties receiving the most SBA loans in Kentucky

Jill Lang // Shutterstock
#35. Wayne County
– July unemployment rate (preliminary): 6.6%
— 1-month change: Up 0.1 percentage points
— 1-year change: Up 0.6 percentage points
– Total labor force: 6,860 people (452 unemployed)

Canva
#34. Morgan County
– July unemployment rate (preliminary): 6.7%
— 1-month change: Up 0.4 percentage points
— 1-year change: Up 0.9 percentage points
– Total labor force: 4,435 people (297 unemployed)

Canva
#33. Bell County
– July unemployment rate (preliminary): 6.7%
— 1-month change: Up 0.1 percentage points
— 1-year change: Up 0.4 percentage points
– Total labor force: 8,473 people (570 unemployed)
Canva
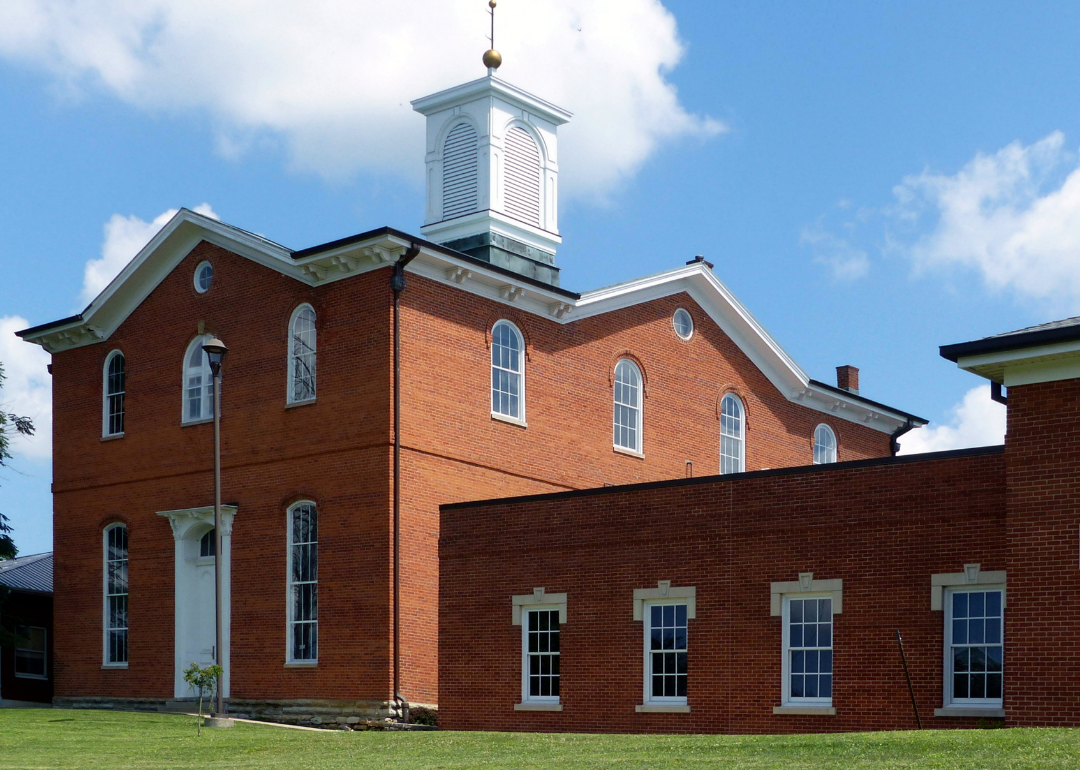
#32. Robertson County
– July unemployment rate (preliminary): 6.8%
— 1-month change: Up 0.3 percentage points
— 1-year change: Up 1.3 percentage points
– Total labor force: 790 people (54 unemployed)

Canva
#31. Ohio County
– July unemployment rate (preliminary): 6.8%
— 1-month change: Up 0.2 percentage points
— 1-year change: Up 1.2 percentage points
– Total labor force: 9,108 people (621 unemployed)
You may also like: How compensation compares between Kentucky staff and travel nurses
Canva
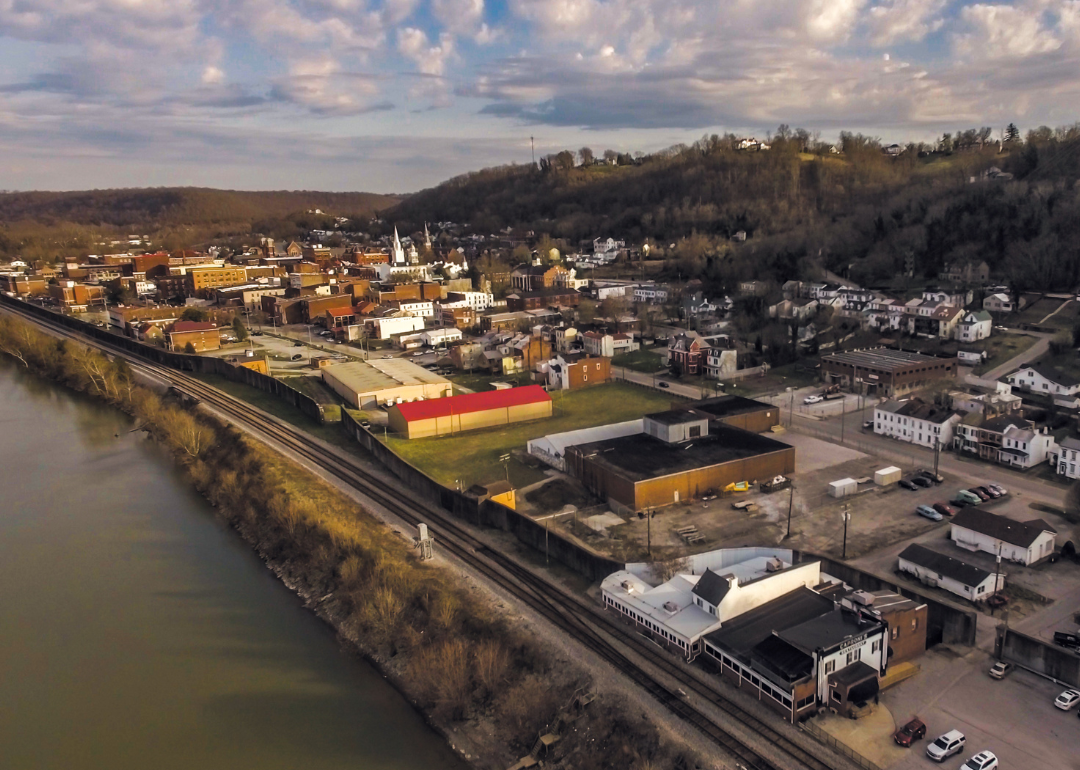
#30. Mason County
– July unemployment rate (preliminary): 6.9%
— 1-month change: Up 0.4 percentage points
— 1-year change: Up 1.3 percentage points
– Total labor force: 6,575 people (454 unemployed)
Canva
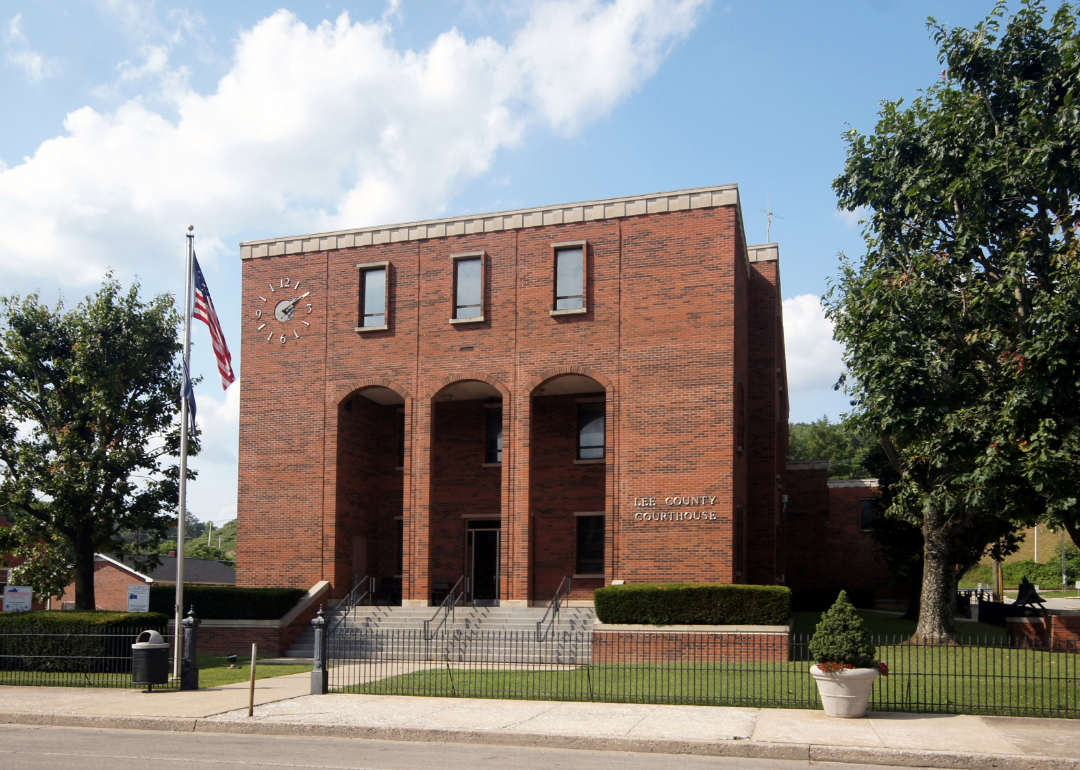
#29. Lee County
– July unemployment rate (preliminary): 7.0%
— 1-month change: Up 0.2 percentage points
— 1-year change: Down 0.2 percentage points
– Total labor force: 2,255 people (157 unemployed)

Canva
#28. Perry County
– July unemployment rate (preliminary): 7.0%
— 1-month change: Up 0.2 percentage points
— 1-year change: Up 0.6 percentage points
– Total labor force: 7,967 people (557 unemployed)
Rosemarie Mosteller // Shutterstock
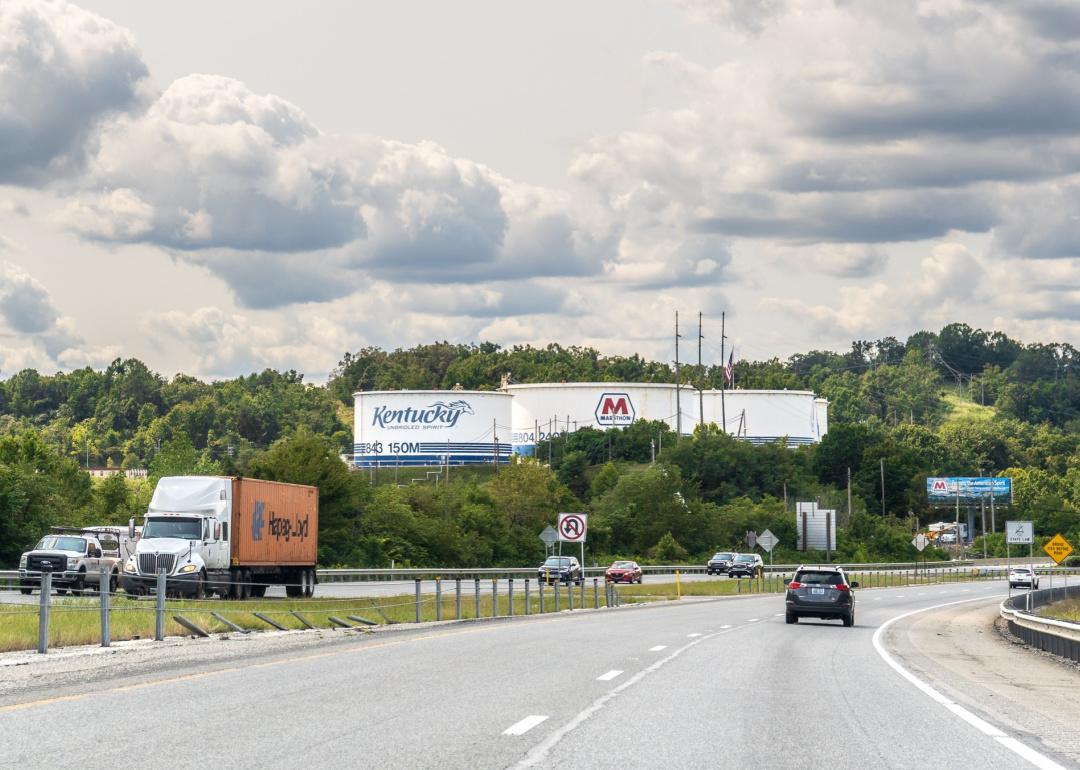
#27. Boyd County
– July unemployment rate (preliminary): 7.0%
— 1-month change: Up 0.5 percentage points
— 1-year change: Up 0.9 percentage points
– Total labor force: 17,339 people (1,216 unemployed)

Canva
#26. Fulton County
– July unemployment rate (preliminary): 7.1%
— 1-month change: Up 0.9 percentage points
— 1-year change: Up 1.4 percentage points
– Total labor force: 2,171 people (155 unemployed)
You may also like: Best amusement parks in Kentucky
Canva
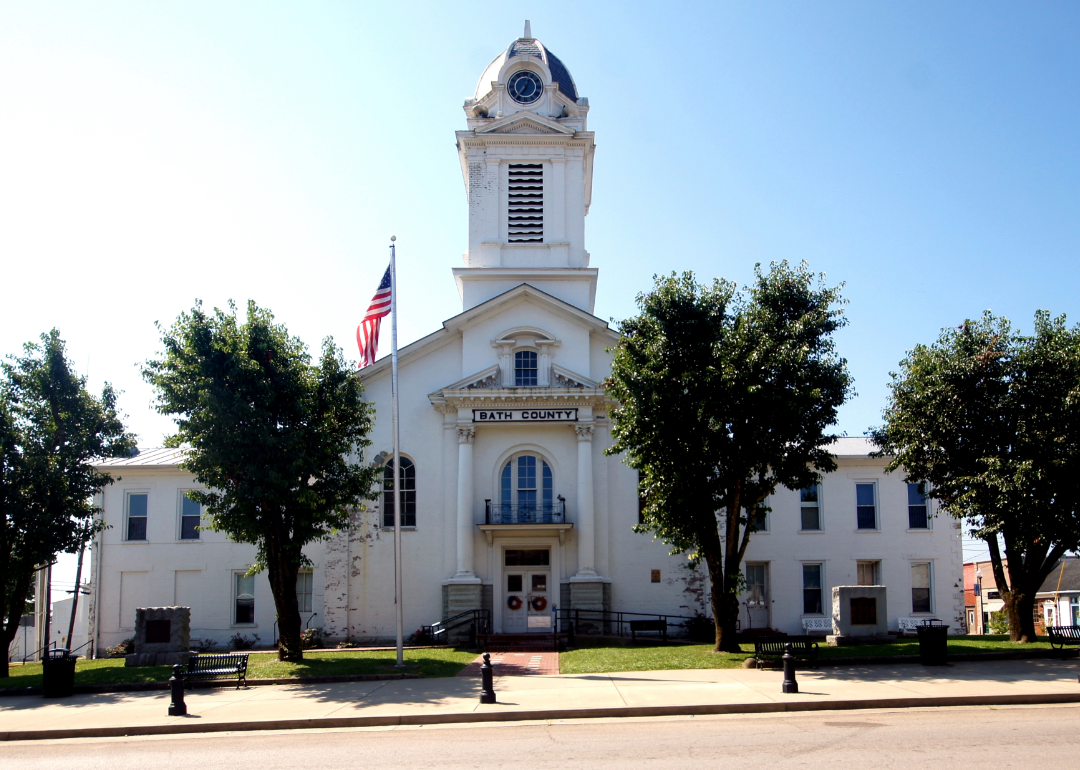
#25. Bath County
– July unemployment rate (preliminary): 7.3%
— 1-month change: Up 0.6 percentage points
— 1-year change: Up 0.7 percentage points
– Total labor force: 4,656 people (341 unemployed)

ScottymanPhoto // Shutterstock
#24. Rowan County
– July unemployment rate (preliminary): 7.3%
— 1-month change: Up 0.6 percentage points
— 1-year change: Up 1.0 percentage points
– Total labor force: 10,307 people (751 unemployed)

Marked Imagery // Shutterstock
#23. Greenup County
– July unemployment rate (preliminary): 7.3%
— 1-month change: Up 0.3 percentage points
— 1-year change: Up 0.5 percentage points
– Total labor force: 12,985 people (954 unemployed)
Canva
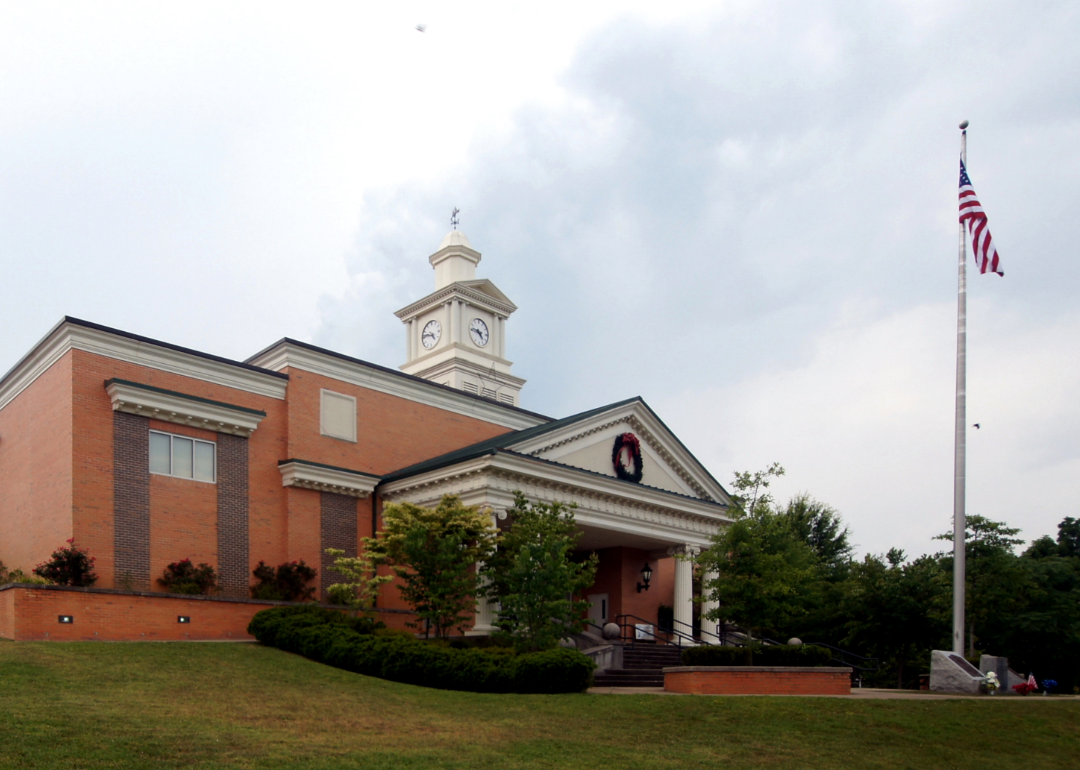
#22. McCreary County
– July unemployment rate (preliminary): 7.4%
— 1-month change: Up 0.3 percentage points
— 1-year change: Up 0.7 percentage points
– Total labor force: 4,613 people (341 unemployed)
Cody Thane Prater // Shutterstock
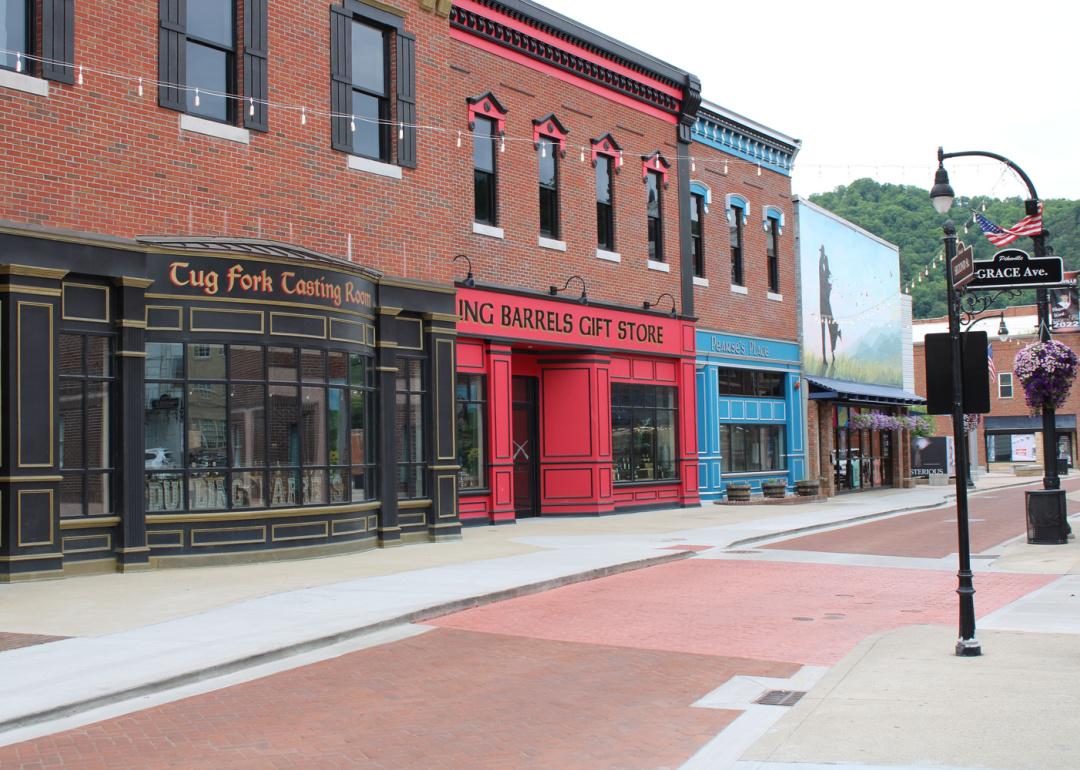
#21. Pike County
– July unemployment rate (preliminary): 7.4%
— 1-month change: Up 0.3 percentage points
— 1-year change: Up 1.1 percentage points
– Total labor force: 19,273 people (1,433 unemployed)
You may also like: How drunk driving fatalities in Kentucky compare to the rest of the US

Canva
#20. Menifee County
– July unemployment rate (preliminary): 7.5%
— 1-month change: Up 0.2 percentage points
— 1-year change: Up 0.2 percentage points
– Total labor force: 2,339 people (176 unemployed)

Canva
#19. Lawrence County
– July unemployment rate (preliminary): 7.5%
— 1-month change: Up 0.7 percentage points
— 1-year change: Up 1.2 percentage points
– Total labor force: 5,861 people (440 unemployed)
Canva
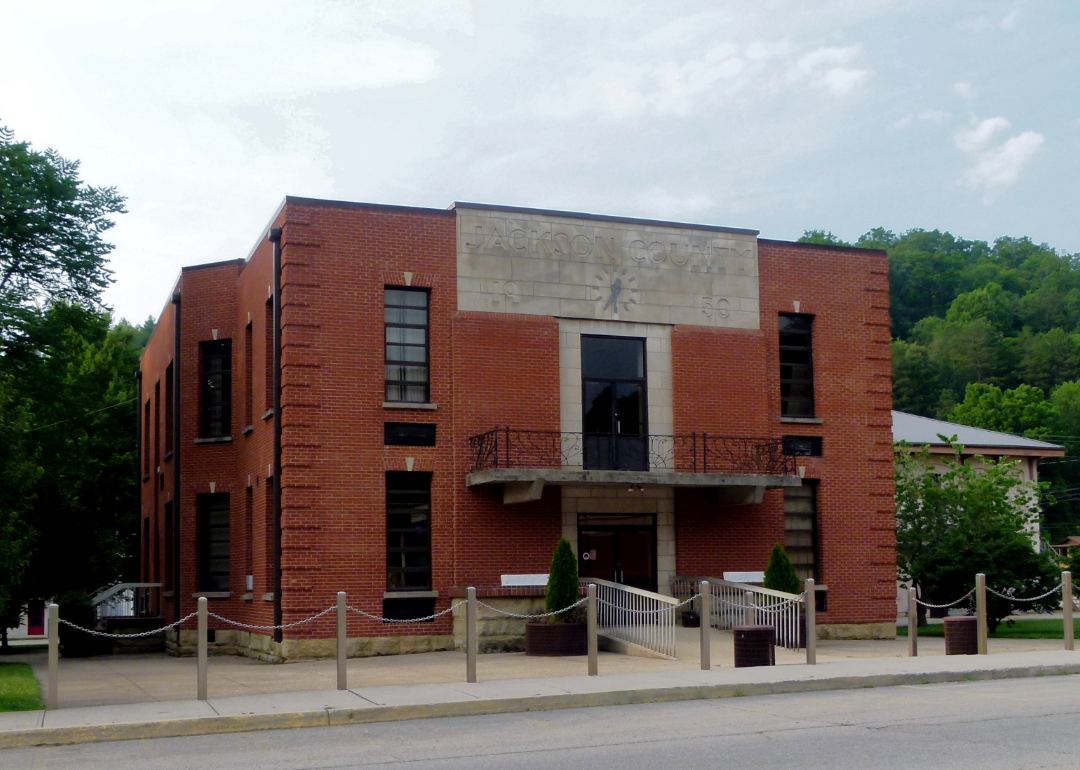
#18. Jackson County
– July unemployment rate (preliminary): 7.6%
— 1-month change: Up 0.4 percentage points
— 1-year change: Up 1.2 percentage points
– Total labor force: 4,168 people (318 unemployed)

Nate Hovee // Shutterstock
#17. Floyd County
– July unemployment rate (preliminary): 7.6%
— 1-month change: Up 0.4 percentage points
— 1-year change: Up 1.1 percentage points
– Total labor force: 11,108 people (842 unemployed)

Canva
#16. Owsley County
– July unemployment rate (preliminary): 7.8%
— 1-month change: Down 0.3 percentage points
— 1-year change: Up 0.1 percentage points
– Total labor force: 1,137 people (89 unemployed)
You may also like: How access to opioid treatments has changed in Kentucky

Canva
#15. Muhlenberg County
– July unemployment rate (preliminary): 7.8%
— 1-month change: Up 0.3 percentage points
— 1-year change: Up 1.3 percentage points
– Total labor force: 10,077 people (786 unemployed)

Canva
#14. Wolfe County
– July unemployment rate (preliminary): 7.9%
— 1-month change: Up 0.4 percentage points
— 1-year change: Up 0.9 percentage points
– Total labor force: 2,258 people (178 unemployed)

Johnnie Laws // Shutterstock
#13. Johnson County
– July unemployment rate (preliminary): 7.9%
— 1-month change: Up 0.2 percentage points
— 1-year change: Up 0.7 percentage points
– Total labor force: 6,881 people (547 unemployed)

Canva
#12. Letcher County
– July unemployment rate (preliminary): 8.0%
— 1-month change: Up 0.3 percentage points
— 1-year change: Up 1.1 percentage points
– Total labor force: 5,997 people (477 unemployed)
Canva
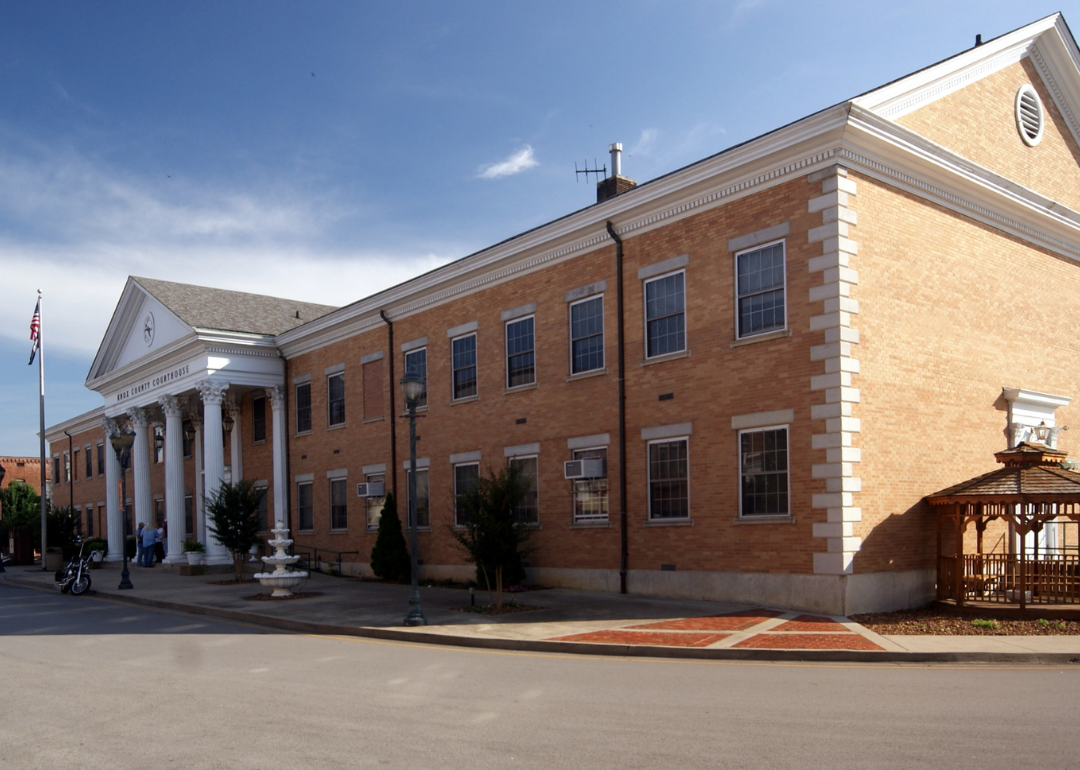
#11. Knox County
– July unemployment rate (preliminary): 8.2%
— 1-month change: Up 0.3 percentage points
— 1-year change: Up 1.6 percentage points
– Total labor force: 9,963 people (815 unemployed)
You may also like: Counties with the most bridges in Kentucky

anthony heflin // Shutterstock
#10. Harlan County
– July unemployment rate (preliminary): 8.3%
— 1-month change: Up 0.1 percentage points
— 1-year change: Up 0.7 percentage points
– Total labor force: 6,494 people (537 unemployed)

Canva
#9. Clay County
– July unemployment rate (preliminary): 8.4%
— 1-month change: Up 0.3 percentage points
— 1-year change: Up 1.3 percentage points
– Total labor force: 5,132 people (433 unemployed)
Canva
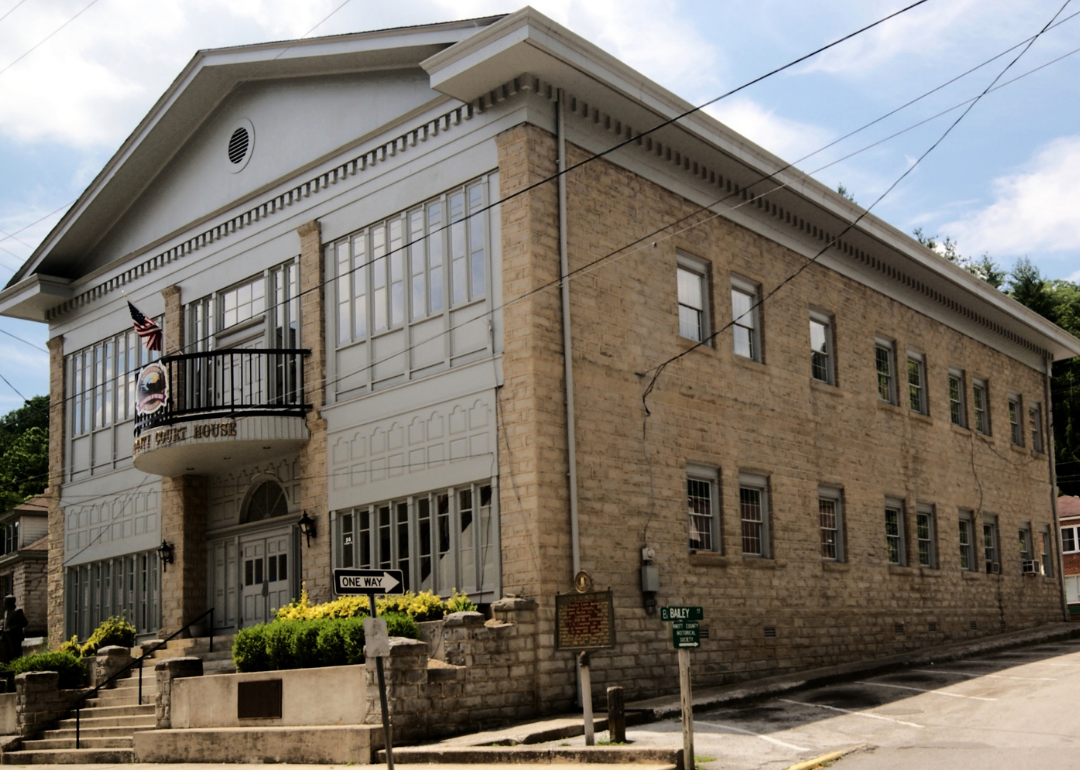
#8. Knott County
– July unemployment rate (preliminary): 8.9%
— 1-month change: Up 0.5 percentage points
— 1-year change: Up 1.3 percentage points
– Total labor force: 4,283 people (380 unemployed)

Canva
#7. Leslie County
– July unemployment rate (preliminary): 9.0%
— 1-month change: Up 0.3 percentage points
— 1-year change: Up 1.1 percentage points
– Total labor force: 2,520 people (227 unemployed)

Canva
#6. Carter County
– July unemployment rate (preliminary): 9.2%
— 1-month change: Up 1.0 percentage points
— 1-year change: Up 0.7 percentage points
– Total labor force: 9,608 people (886 unemployed)
You may also like: Airports using biometric facial recognition in Kentucky

Canva
#5. Elliott County
– July unemployment rate (preliminary): 9.3%
— 1-month change: Up 0.6 percentage points
— 1-year change: Up 1.1 percentage points
– Total labor force: 1,881 people (175 unemployed)

Canva
#4. Lewis County
– July unemployment rate (preliminary): 9.4%
— 1-month change: Up 1.0 percentage points
— 1-year change: Up 1.1 percentage points
– Total labor force: 4,475 people (419 unemployed)

Canva
#3. Breathitt County
– July unemployment rate (preliminary): 9.9%
— 1-month change: Up 0.1 percentage points
— 1-year change: Up 1.5 percentage points
– Total labor force: 3,120 people (310 unemployed)
Canva
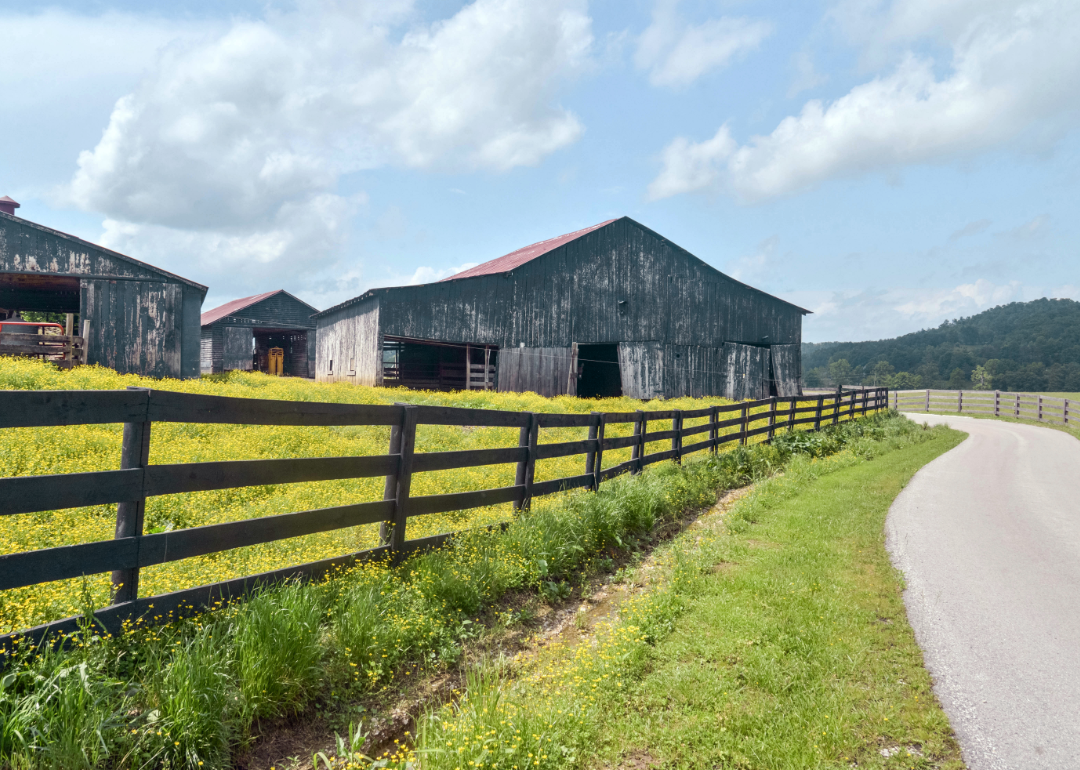
#2. Martin County
– July unemployment rate (preliminary): 11.0%
— 1-month change: Up 0.3 percentage points
— 1-year change: Up 1.1 percentage points
– Total labor force: 2,219 people (244 unemployed)

Cindy1988 // Shutterstock
#1. Magoffin County
– July unemployment rate (preliminary): 11.3%
— 1-month change: Up 0.7 percentage points
— 1-year change: Up 1.5 percentage points
– Total labor force: 3,262 people (370 unemployed)
This story features data reporting and writing by Paxtyn Merten and is part of a series utilizing data automation across 50 states.
You may also like: Counties with the most tornadoes in Kentucky


