Counties with the highest unemployment in Kentucky
Published 4:50 pm Friday, October 4, 2024
Counties with the highest unemployment in Kentucky
Unemployment rates have continued to rise across U.S. metropolitan areas, provoking alarm throughout the nation and guiding the Federal Reserve’s decision to cut interest rates last month.
As of August, unemployment rates had increased from the previous year in 315 out of 389 U.S. metros areas—including 45 of the 51 largest metros, according to Bureau of Labor Statistics data.
To get a glimpse of regional variations in employment, Stacker compiled a list of counties with the highest unemployment rates in Kentucky, using BLS data. Counties are ranked by their preliminary unemployment rate in August 2024, with initial ties broken by the number of unemployed people within that county, though some ties may remain. County-level unemployment rates are not seasonally adjusted.
The national unemployment rate remains relatively low at 4.1% in September, down slightly from the previous month. Still, it’s up substantially from 3.8% during the same month last year and remains higher than it had otherwise been since December 2021. By comparison, unemployment rates surged to 10% in October 2009 during the Great Recession, and a full recovery took years. At the height of the brief COVID-19 recession in April 2020, unemployment hit 14.7%.
The Federal Reserve has shifted its focus from curbing inflation to unemployment, cutting interest rates to alleviate economic strain and spur job growth.
Since last year, unemployment has spiked in half of states—a signal often indicating a looming recession, as Piper Sandler Chief Global Economist Nancy Lazar told Business Insider. These jobless rates, paired with layoffs among major U.S. employers like Google and Tesla, have sparked concern among Americans. Minus a major economic blow, economists continue to forecast that the U.S. is tracking toward an incremental slowdown in growth known as a “soft landing.” The Fed plans to continue cutting rates to achieve this.
To get a better idea of your community’s current economy, read on to see the counties with the highest unemployment in Kentucky.
You may also like: Strawberries, romaine lettuce, and other groceries that rose in price in the South last month
![]()

Canva
#50. Calloway County
– August unemployment rate (preliminary): 5.8%
— 1-month change: Up 0.1 percentage points
— 1-year change: Up 1.3 percentage points
– Total labor force: 17,203 people (991 unemployed)

JNix // Shutterstock
#49. Laurel County
– August unemployment rate (preliminary): 5.8%
— 1-month change: No change
— 1-year change: Up 1.2 percentage points
– Total labor force: 25,076 people (1,464 unemployed)

Canva
#48. Morgan County
– August unemployment rate (preliminary): 5.9%
— 1-month change: Down 0.8 percentage points
— 1-year change: Up 1.4 percentage points
– Total labor force: 4,553 people (269 unemployed)

Canva
#47. Pulaski County
– August unemployment rate (preliminary): 5.9%
— 1-month change: Up 0.1 percentage points
— 1-year change: Up 1.2 percentage points
– Total labor force: 25,796 people (1,510 unemployed)

Canva
#46. Livingston County
– August unemployment rate (preliminary): 6.0%
— 1-month change: No change
— 1-year change: Up 1.4 percentage points
– Total labor force: 3,734 people (223 unemployed)
You may also like: Best private high schools in Kentucky

Wangkun Jia // Shutterstock
#45. Edmonson County
– August unemployment rate (preliminary): 6.0%
— 1-month change: No change
— 1-year change: Up 0.9 percentage points
– Total labor force: 4,942 people (298 unemployed)

Canva
#44. Lincoln County
– August unemployment rate (preliminary): 6.0%
— 1-month change: No change
— 1-year change: Up 0.9 percentage points
– Total labor force: 9,442 people (568 unemployed)

Canva
#43. Christian County
– August unemployment rate (preliminary): 6.0%
— 1-month change: Down 0.1 percentage points
— 1-year change: Up 1.0 percentage points
– Total labor force: 25,022 people (1,512 unemployed)

Canva
#42. McLean County
– August unemployment rate (preliminary): 6.1%
— 1-month change: Down 0.2 percentage points
— 1-year change: Up 1.8 percentage points
– Total labor force: 3,935 people (239 unemployed)

Patrick Jennings // Shutterstock
#41. Fleming County
– August unemployment rate (preliminary): 6.1%
— 1-month change: Down 0.4 percentage points
— 1-year change: Up 1.5 percentage points
– Total labor force: 5,851 people (355 unemployed)
You may also like: How much manufacturers in Kentucky spend on equipment

Canva
#40. Union County
– August unemployment rate (preliminary): 6.1%
— 1-month change: No change
— 1-year change: Up 1.0 percentage points
– Total labor force: 6,115 people (376 unemployed)

Maxine Livingston // Shutterstock
#39. Estill County
– August unemployment rate (preliminary): 6.2%
— 1-month change: Down 0.1 percentage points
— 1-year change: Up 1.3 percentage points
– Total labor force: 5,239 people (327 unemployed)

Gabriel Quiles // Shutterstock
#38. Russell County
– August unemployment rate (preliminary): 6.2%
— 1-month change: Up 0.2 percentage points
— 1-year change: Up 1.4 percentage points
– Total labor force: 6,615 people (410 unemployed)
Canva
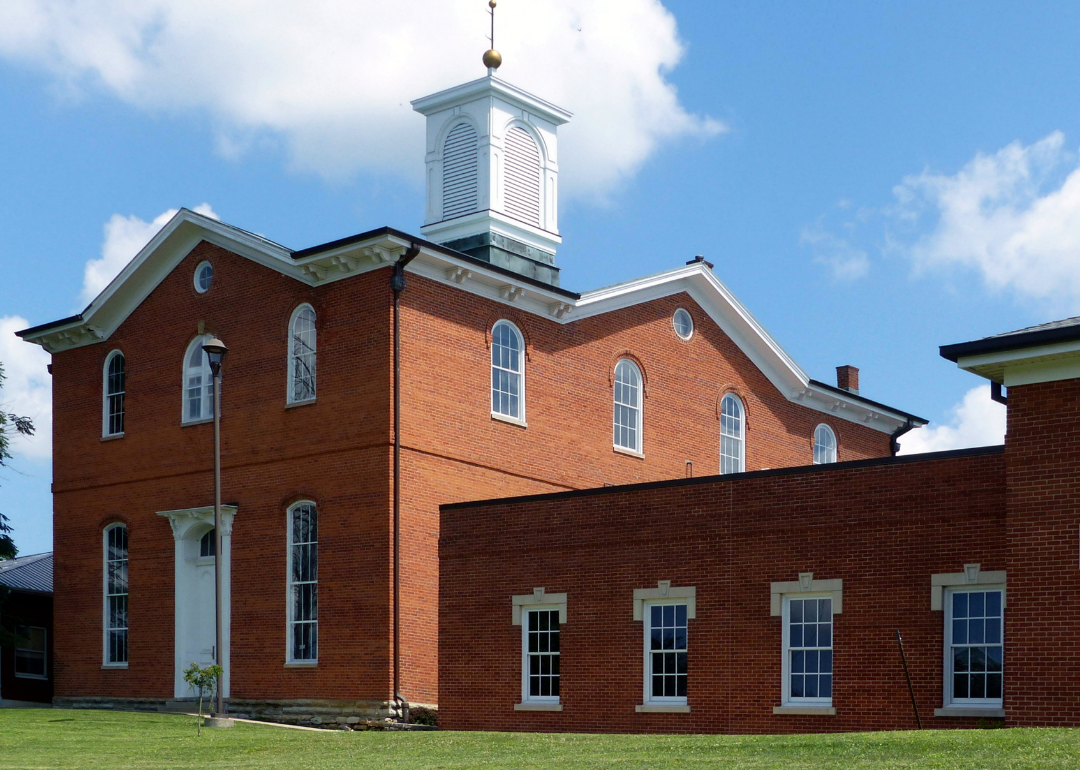
#37. Robertson County
– August unemployment rate (preliminary): 6.4%
— 1-month change: Down 0.4 percentage points
— 1-year change: Up 1.7 percentage points
– Total labor force: 802 people (51 unemployed)

Canva
#36. Fulton County
– August unemployment rate (preliminary): 6.4%
— 1-month change: Down 0.9 percentage points
— 1-year change: Up 1.7 percentage points
– Total labor force: 2,175 people (140 unemployed)
You may also like: How many people are receiving mental health treatment in Kentucky
Canva
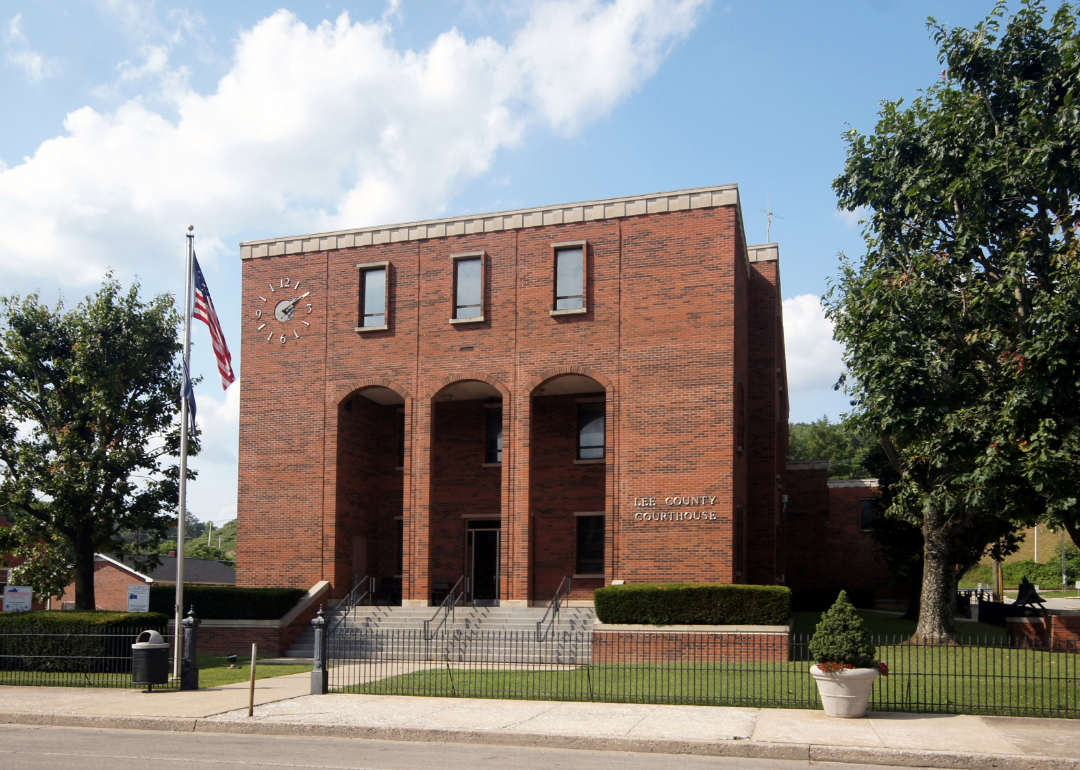
#35. Lee County
– August unemployment rate (preliminary): 6.4%
— 1-month change: Down 0.7 percentage points
— 1-year change: Up 0.5 percentage points
– Total labor force: 2,288 people (146 unemployed)

Canva
#34. Clinton County
– August unemployment rate (preliminary): 6.5%
— 1-month change: Up 0.1 percentage points
— 1-year change: Up 1.7 percentage points
– Total labor force: 3,428 people (224 unemployed)

Jill Lang // Shutterstock
#33. Wayne County
– August unemployment rate (preliminary): 6.5%
— 1-month change: Down 0.1 percentage points
— 1-year change: Up 1.2 percentage points
– Total labor force: 6,962 people (450 unemployed)

Canva
#32. Adair County
– August unemployment rate (preliminary): 6.5%
— 1-month change: No change
— 1-year change: Up 1.3 percentage points
– Total labor force: 7,463 people (485 unemployed)

Sean Pavone // Shutterstock
#31. Whitley County
– August unemployment rate (preliminary): 6.5%
— 1-month change: No change
— 1-year change: Up 1.5 percentage points
– Total labor force: 13,955 people (902 unemployed)
You may also like: Average student loan debt increased in first half of 2024 in Kentucky

Canva
#30. Ohio County
– August unemployment rate (preliminary): 6.6%
— 1-month change: Down 0.3 percentage points
— 1-year change: Up 1.5 percentage points
– Total labor force: 9,271 people (609 unemployed)
Canva
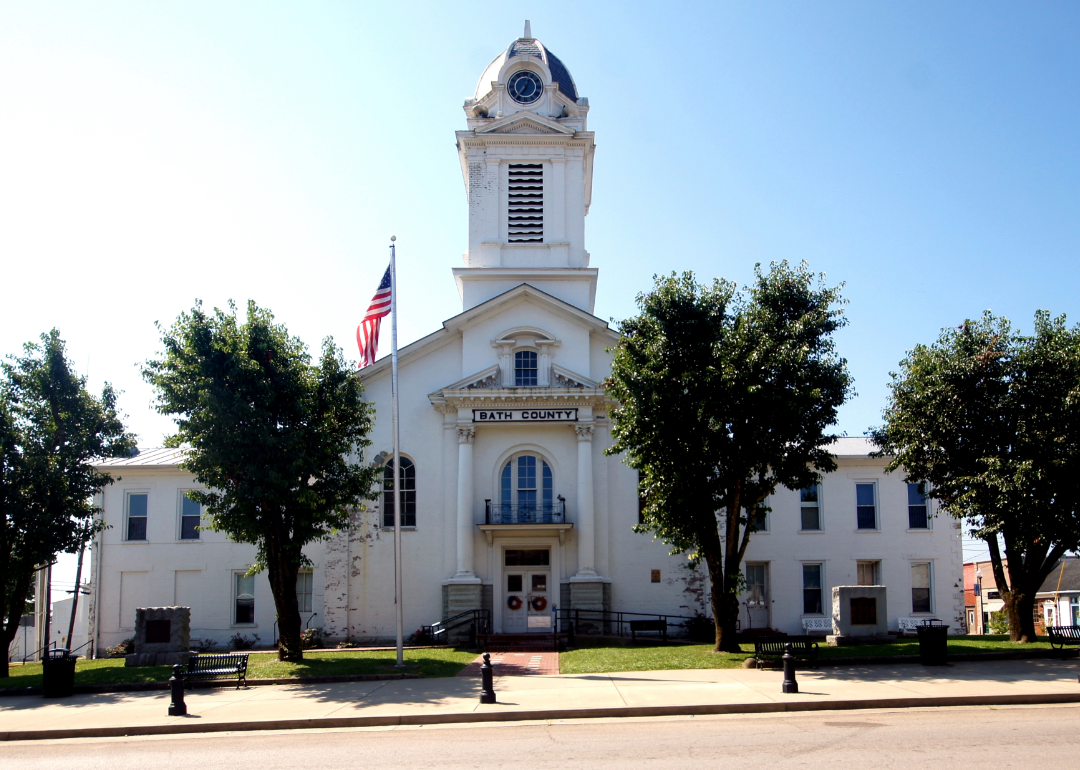
#29. Bath County
– August unemployment rate (preliminary): 6.7%
— 1-month change: Down 0.7 percentage points
— 1-year change: Up 1.3 percentage points
– Total labor force: 4,679 people (313 unemployed)
Canva
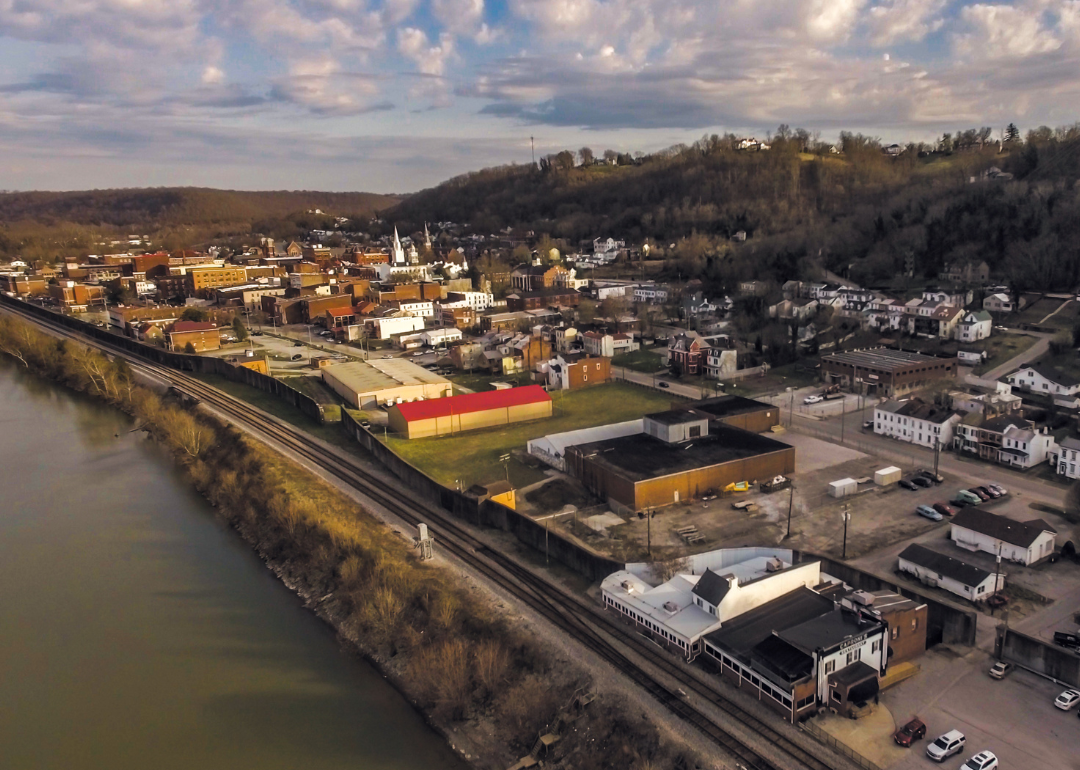
#28. Mason County
– August unemployment rate (preliminary): 6.8%
— 1-month change: Down 0.2 percentage points
— 1-year change: Up 1.9 percentage points
– Total labor force: 6,616 people (453 unemployed)

Canva
#27. Bell County
– August unemployment rate (preliminary): 6.8%
— 1-month change: Up 0.1 percentage points
— 1-year change: Up 1.0 percentage points
– Total labor force: 8,510 people (576 unemployed)
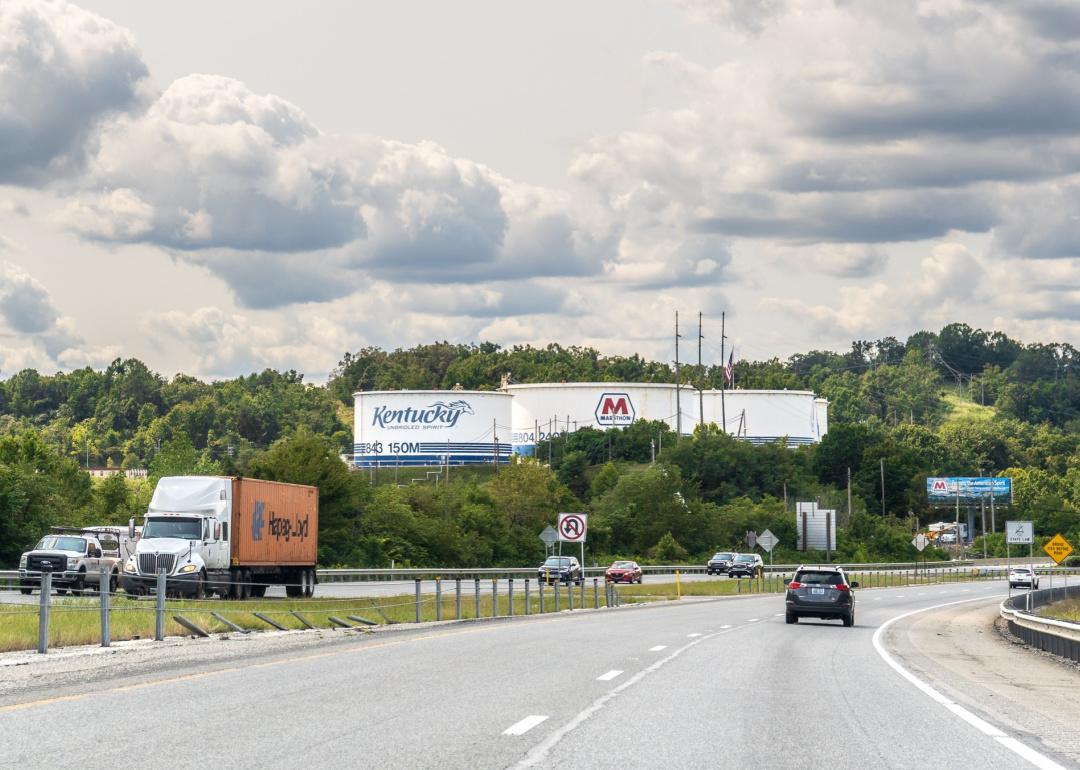
Rosemarie Mosteller // Shutterstock
#26. Boyd County
– August unemployment rate (preliminary): 6.8%
— 1-month change: Down 0.1 percentage points
— 1-year change: Up 1.2 percentage points
– Total labor force: 17,339 people (1,174 unemployed)
You may also like: Counties with the most assisted-living facilities in Kentucky

Canva
#25. Lawrence County
– August unemployment rate (preliminary): 6.9%
— 1-month change: Down 0.4 percentage points
— 1-year change: Up 1.2 percentage points
– Total labor force: 5,960 people (411 unemployed)

Canva
#24. Perry County
– August unemployment rate (preliminary): 6.9%
— 1-month change: Down 0.1 percentage points
— 1-year change: Up 1.2 percentage points
– Total labor force: 8,080 people (559 unemployed)

ScottymanPhoto // Shutterstock
#23. Rowan County
– August unemployment rate (preliminary): 7.0%
— 1-month change: Down 0.3 percentage points
— 1-year change: Up 1.5 percentage points
– Total labor force: 10,391 people (727 unemployed)

Marked Imagery // Shutterstock
#22. Greenup County
– August unemployment rate (preliminary): 7.1%
— 1-month change: Down 0.2 percentage points
— 1-year change: Up 0.9 percentage points
– Total labor force: 12,997 people (924 unemployed)

Canva
#21. Wolfe County
– August unemployment rate (preliminary): 7.2%
— 1-month change: Down 0.9 percentage points
— 1-year change: Up 1.5 percentage points
– Total labor force: 2,266 people (163 unemployed)
You may also like: Where are all these trucks headed? The top destinations for Kentucky freight.
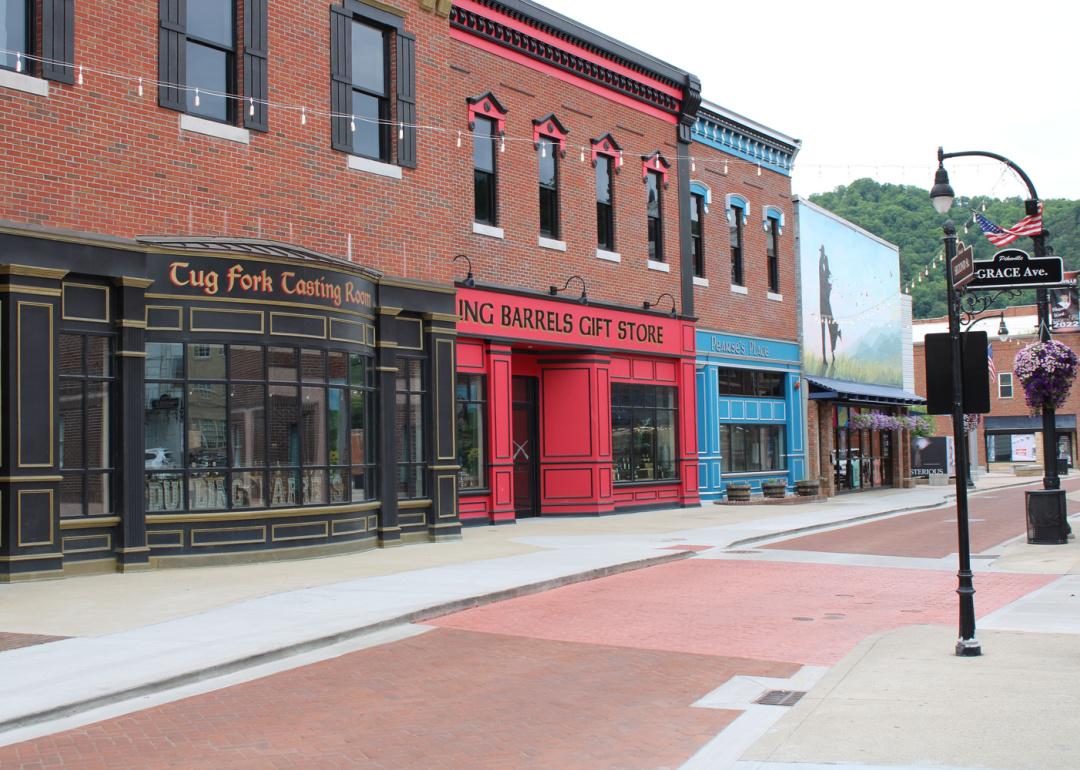
Cody Thane Prater // Shutterstock
#20. Pike County
– August unemployment rate (preliminary): 7.2%
— 1-month change: Down 0.2 percentage points
— 1-year change: Up 1.5 percentage points
– Total labor force: 19,353 people (1,398 unemployed)

Canva
#19. Menifee County
– August unemployment rate (preliminary): 7.3%
— 1-month change: Down 0.4 percentage points
— 1-year change: Up 1.7 percentage points
– Total labor force: 2,363 people (172 unemployed)
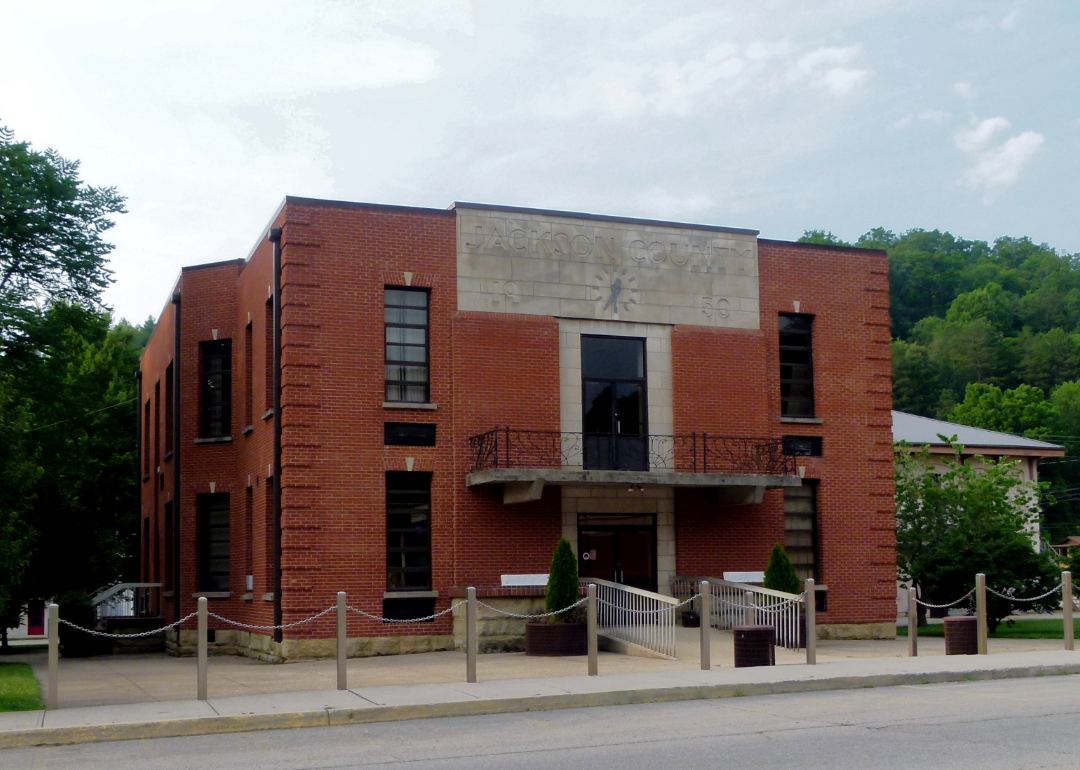
Canva
#18. Jackson County
– August unemployment rate (preliminary): 7.3%
— 1-month change: Down 0.3 percentage points
— 1-year change: Up 1.5 percentage points
– Total labor force: 4,300 people (316 unemployed)
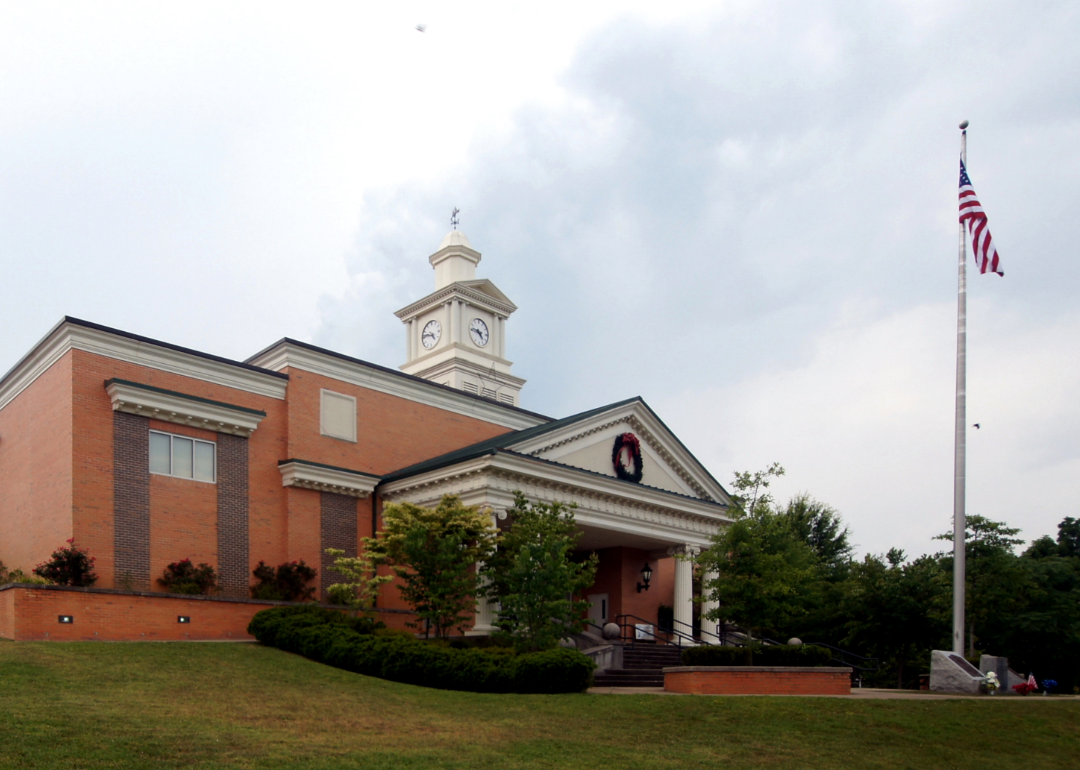
Canva
#17. McCreary County
– August unemployment rate (preliminary): 7.5%
— 1-month change: Up 0.1 percentage points
— 1-year change: Up 1.5 percentage points
– Total labor force: 4,676 people (350 unemployed)

Canva
#16. Muhlenberg County
– August unemployment rate (preliminary): 7.5%
— 1-month change: Down 0.3 percentage points
— 1-year change: Up 1.5 percentage points
– Total labor force: 10,164 people (760 unemployed)
You may also like: Counties with the highest rates of high blood pressure in Kentucky

Nate Hovee // Shutterstock
#15. Floyd County
– August unemployment rate (preliminary): 7.6%
— 1-month change: No change
— 1-year change: Up 1.7 percentage points
– Total labor force: 11,168 people (850 unemployed)
Canva
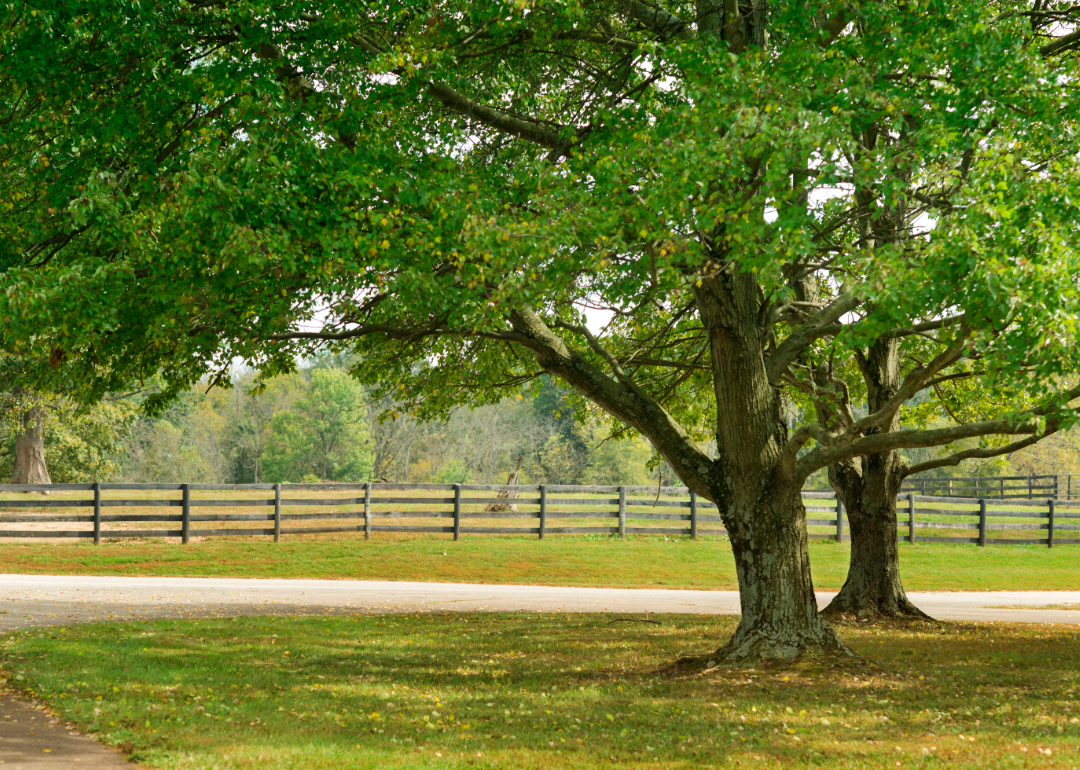
#14. Owsley County
– August unemployment rate (preliminary): 7.8%
— 1-month change: No change
— 1-year change: Up 1.0 percentage points
– Total labor force: 1,163 people (91 unemployed)

Johnnie Laws // Shutterstock
#13. Johnson County
– August unemployment rate (preliminary): 7.9%
— 1-month change: Down 0.1 percentage points
— 1-year change: Up 1.5 percentage points
– Total labor force: 6,904 people (546 unemployed)
Canva
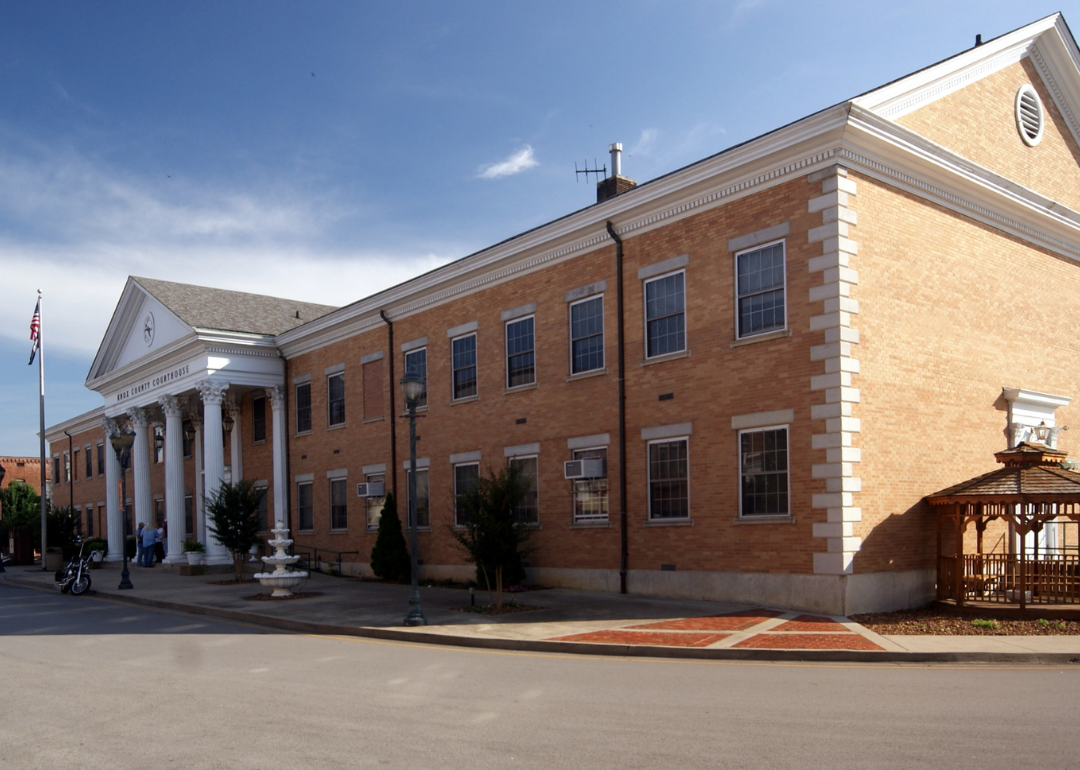
#12. Knox County
– August unemployment rate (preliminary): 8.0%
— 1-month change: Down 0.3 percentage points
— 1-year change: Up 2.0 percentage points
– Total labor force: 10,027 people (798 unemployed)

Canva
#11. Letcher County
– August unemployment rate (preliminary): 8.1%
— 1-month change: Up 0.1 percentage points
— 1-year change: Up 1.9 percentage points
– Total labor force: 6,094 people (493 unemployed)
You may also like: Cities with the fastest-growing home prices in Kentucky

Canva
#10. Lewis County
– August unemployment rate (preliminary): 8.3%
— 1-month change: Down 1.1 percentage points
— 1-year change: Up 1.3 percentage points
– Total labor force: 4,462 people (370 unemployed)

Canva
#9. Clay County
– August unemployment rate (preliminary): 8.3%
— 1-month change: Down 0.1 percentage points
— 1-year change: Up 1.9 percentage points
– Total labor force: 5,291 people (437 unemployed)

anthony heflin // Shutterstock
#8. Harlan County
– August unemployment rate (preliminary): 8.5%
— 1-month change: Up 0.3 percentage points
— 1-year change: Up 1.3 percentage points
– Total labor force: 6,566 people (556 unemployed)
Canva
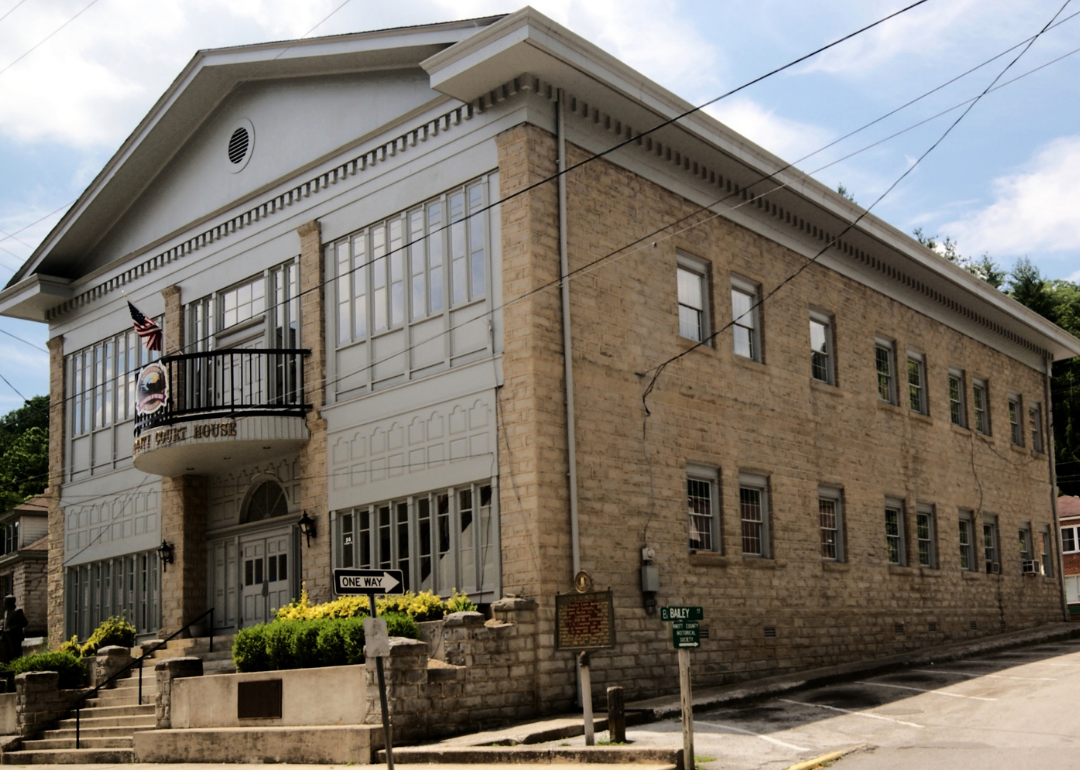
#7. Knott County
– August unemployment rate (preliminary): 8.6%
— 1-month change: Down 0.3 percentage points
— 1-year change: Up 2.0 percentage points
– Total labor force: 4,341 people (373 unemployed)

Canva
#6. Carter County
– August unemployment rate (preliminary): 8.7%
— 1-month change: Down 0.3 percentage points
— 1-year change: Up 1.0 percentage points
– Total labor force: 9,602 people (833 unemployed)
You may also like: Cities with the most expensive homes in Kentucky

Canva
#5. Elliott County
– August unemployment rate (preliminary): 8.9%
— 1-month change: Down 0.3 percentage points
— 1-year change: Up 1.6 percentage points
– Total labor force: 1,907 people (170 unemployed)

Canva
#4. Leslie County
– August unemployment rate (preliminary): 8.9%
— 1-month change: No change
— 1-year change: Up 1.4 percentage points
– Total labor force: 2,555 people (227 unemployed)

Canva
#3. Breathitt County
– August unemployment rate (preliminary): 9.7%
— 1-month change: Down 0.7 percentage points
— 1-year change: Up 2.5 percentage points
– Total labor force: 3,144 people (304 unemployed)

Canva
#2. Martin County
– August unemployment rate (preliminary): 10.6%
— 1-month change: Down 0.2 percentage points
— 1-year change: Up 1.7 percentage points
– Total labor force: 2,220 people (236 unemployed)

Cindy1988 // Shutterstock
#1. Magoffin County
– August unemployment rate (preliminary): 11.3%
— 1-month change: Down 0.2 percentage points
— 1-year change: Up 1.5 percentage points
– Total labor force: 3,342 people (378 unemployed)
This story features data reporting and writing by Paxtyn Merten and is part of a series utilizing data automation across 50 states.
You may also like: What Medicaid acceptance looks like at Kentucky substance use treatment centers


